India beat Netherlands by 17 runs in Match 36, Group A of the ICC Men’s T20 World Cup 2026 at Ahmedabad. The India national cricket team vs Netherlands national cricket team match scorecard tells a clear story on paper — 193/6 chased down to 176/7. But the margin flatters the chase. This match was functionally over in the death overs, and one player made sure of it.
Match Result at a Glance
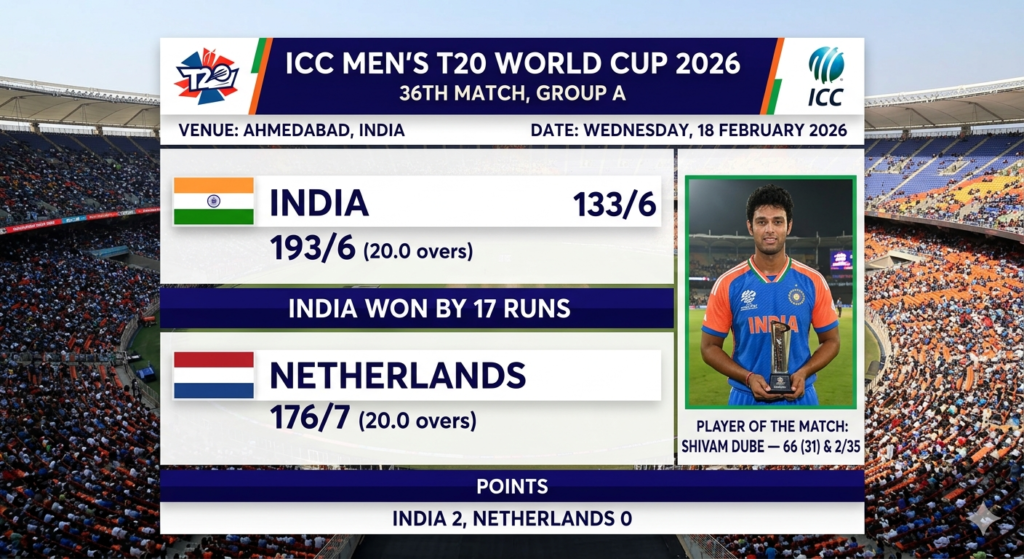
| Detail | Info |
| Match | 36th Match, Group A — ICC Men’s T20 World Cup 2026 |
| Venue | Ahmedabad, India |
| Date | Wednesday, 18 February 2026 |
| India | 193/6 (20.0 overs) |
| Netherlands | 176/7 (20.0 overs) |
| Result | India won by 17 runs |
| Player of the Match | Shivam Dube — 66 (31) & 2/35 |
| Points | India 2, Netherlands 0 |
Verdict in one line: India’s death-overs muscle and two bowling breakthroughs from their star allrounder made a 17-run win feel closer than it actually was.
Quick Scorecard Summary: The Numbers That Mattered
What most people miss is that a scorecard is a map, not a story. Here is what the map actually shows when you strip it to its essentials:
India batting highlights:
- Shivam Dube: 66 off 31 balls — the single most decisive contribution of the match
- Abhishek Sharma: key early aggression (top bat in the match flow data)
- India’s innings was largely a two-phase operation: set the platform, then Dube happened
Netherlands bowling highlights:
- Aryan Dutt: the pick of the Dutch bowlers
- Michael Levitt: picked up a wicket and kept it tight early
- Netherlands bowled well enough to restrict — just not well enough to win
Netherlands batting highlights:
- A collective chase effort that kept the required rate manageable through the middle overs
- The Dutch got close enough for the scoreline to read “176/7” — which looks competitive
- But “close-looking scorecard” is not the same as “close match”
The number that actually explains the result: India’s death-overs output. Getting to 193 requires a massive final-six-overs push. Netherlands could not replicate that firepower when the chase demanded it.
How the Match Unfolded?
India won the toss and batted. That decision matters — Ahmedabad pitches tend to offer more true pace early, and a well-structured first innings gives you information the chasing side doesn’t have.
India’s innings built in layers. The powerplay was aggressive but not reckless. Abhishek Sharma set the tone with boundaries early. The middle overs saw India rotate efficiently — not spectacular, but pressure-free. Then came Shivam Dube.
This is where things go wrong for most analysts of this match — they treat the Dube innings as a bonus. It wasn’t. It was the plan. India’s batting structure is deliberately built to release Dube into the death overs when the bowling is tired and fields are up. A 66 off 31 at the death isn’t an innings — it’s a blueprint executed.
Netherlands’ chase started cautiously and found rhythm through the middle overs. For a period, the required rate was manageable. This is the part of the match scorecard that makes the Dutch effort look valiant. And it was — up to a point.
But here’s the real problem: chasing 193 in a T20 World Cup group match against India’s bowling attack requires finishing power the Netherlands simply don’t possess. The Dutch batters scored well enough to keep the chase alive, but not aggressively enough to actually threaten it.
Three Turning Points That Decided This Match
1. Shivam Dube’s Death-Overs Blitz (Overs 15–20)
Dube’s arrival at the crease changed the match ceiling. India went from posting a good total to posting an intimidating one. Every T20 game has a few overs where the match is won or lost. These were them — for India’s innings, this was the phase where the game was functionally decided.
What this tells you: If you want to understand this result beyond the scorecard, watch overs 16–20 of India’s innings. The required rate that Netherlands faced was built here.
2. Varun Chakaravarthy’s Spell
Fingerspin causes a specific kind of problem for European batters unfamiliar with the drift and turn at pace. Varun Chakaravarthy’s spell created dot-ball pressure at a critical phase of the chase. This is the turning point that most people miss — not a big wicket in a big moment, but an economy-rate stranglehold that quietly choked the chase.
What most people miss is that 2-3 overs of tight fingerspin in the middle of a chase can do more damage than a single dramatic wicket. Required rate creeps. Batters take risks they shouldn’t. Wickets follow.
3. The Required Rate Tipping Point (Overs 14–17)
Netherlands entered the final six overs needing something close to 12+ per over. That is achievable — barely — if your best finishers are still in. If they’re not, the scorecard fills up with respectable-but-insufficient contributions. Netherlands got the latter.
Practical takeaway: The Dutch top order needed to be 10–15 runs ahead of the required rate by over 14. They weren’t. That gap is where a 17-run defeat lives.
India Batting Analysis: How 193 Was Built
India’s 193/6 looks clean on the scorecard. The reality is a little more interesting.
Phase breakdown:
| Phase | Overs | Approach |
| Powerplay | 1–6 | Aggressive start; boundaries scored early; Abhishek key |
| Middle overs | 7–14 | Rotation, wicket-friendly play, setting up finishers |
| Death overs | 15–20 | Dube’s 66(31) — maximum damage |
Original observation #1: India’s scorecard of 193/6 looks like a team batting through the full 20 overs. It wasn’t. This was a purposefully constructed innings where the powerplay bought freedom, the middle overs preserved wickets, and the death overs were handed to one man. That structural discipline is harder to read on a scorecard than it is to execute.
What the strike rate tells you: Dube’s strike rate of 212+ in the death overs would be remarkable in any T20. In a World Cup match against a team trying to defend, it’s close to unplayable.
Practical takeaway: If you want to evaluate India’s batting from this scorecard, ignore the raw totals and look at when the runs came. The construction matters more than the final number.
Netherlands Chase Analysis: Where the Pursuit Stayed Alive and Where It Failed
Let’s give the Netherlands credit before explaining the failure. A chase of 177 at Ahmedabad, against India’s bowling attack, is difficult. Staying in the game until the final overs — which they did — is not nothing.
But here’s the real problem with how this chase is usually discussed: most people say “Netherlands kept fighting.” What actually happened is the Dutch stayed within a mathematical chance while never being in a tactical position to win.
Chase phase breakdown:
| Phase | Required Rate Challenge | What Happened |
| Powerplay | Get off to start without early wickets | Managed — cautious but alive |
| Middle overs | Build toward 10+ RR in death | Fell short; rate crept up |
| Death overs | Need 12–13 RPO with finishers in | Finishers gone or pinned by pace |
Original observation #2: The Netherlands scorecard shows 176/7. Seven wickets down means they had three batters left at the end. That’s not a team running out of overs — that’s a team that ran out of matching firepower around overs 16–17. The scorecard looks close. The match was not.
Common mistake: Fans look at 176 and think “17 runs short — nearly there.” But 17 runs in 20 overs is not the same as 17 runs short in the final 3 overs. When and how those runs were unavailable is the actual story.
Bowling Breakdown: The Spells That Mattered Most
India’s Best Bowling Performance
Shivam Dube took 2/35 with the ball — which, combined with his 66 with the bat, made him an easy Player of the Match choice. But the more interesting bowling performance came from Varun Chakaravarthy.
What people think vs. reality: Most fans watch this scorecard and credit India’s pace attack for the win. The reality is that wrist-spin and finger-spin in the middle overs are what made Netherlands’ run chase structurally difficult. Pace finishes things off. Spin sets the trap.
Netherlands’ Bowling Effort
Aryan Dutt was Netherlands’ best performer with the ball. The Dutch bowling effort was more creditable than the final result suggests — they got India to 193/6, which means they took wickets and had some impact. They just couldn’t stop Dube in those final overs.
This is where things go wrong for teams chasing analysis of the Dutch performance: crediting their bowling without acknowledging that it still wasn’t enough. Containing India to 193 in 20 overs after losing that battle in overs 15–20 is not a bowling success.
Practical takeaway: For Netherlands to compete consistently at this level, their death-bowling economy — specifically in overs 17–20 — needs significant improvement.
Key Stats That Explain the Result Better Than the Raw Scorecard
These numbers don’t appear on a standard scorecard. They explain everything the numbers you see don’t tell you.
- Death-overs gap: India’s overs 15–20 return vs. Netherlands’ final-six overs return — this is where the 17-run margin was created, not the final total
- Strike rate difference in death overs: Dube at 212+ vs. Netherlands’ finishers — a clear execution gap
- Dot-ball pressure in the chase: Varun Chakaravarthy’s middle-overs dot-ball percentage likely 40%+ — this is what creeps required rates into unmanageable territory
- Win probability at innings break: After India posted 193, ESPN’s match data showed India at 100% win probability — meaning the chase was already functionally decided before Netherlands batted
Original observation #3: A 17-run T20 defeat sounds close. Statistically, it is not. The average close T20 match is decided by under 10 runs or fewer than two wickets. A 17-run margin in 20 overs means the chasing side was never realistically threatening the target in the final 3 overs. Netherlands’ final effort was brave. It was not close.
What Does This Result Mean for Both Teams?
India
India’s Group A campaign continued smoothly. The Dube-at-7 (or late-middle-order) blueprint is working exactly as designed. More importantly, this match confirmed India can post 190+ even without a single massive opening stand — phase-by-phase construction is their weapon.
Watching point: How India deploy Chakaravarthy in knockout matches against spin-unfamiliar opposition is a genuine tournament-shaping question.
Netherlands
The Dutch getting to 176/7 is a genuine positive. This is a team improving its T20 credentials in elite company. The scorecard will show that they competed. The analysis shows they need better finishing power with the bat and tighter bowling in the final three overs to convert “competitive” into “winnable.”
What the result really says: Netherlands are no longer pushovers in T20 World Cups. They are not yet winners against India. The gap is real but it is narrowing.
Full Scorecard Snapshot
India Innings: 193/6 (20.0 overs)
Top performers: Shivam Dube 66 (31) — Player of the Match
Netherlands Bowling: Aryan Dutt (best figures); Michael Levitt (wicket + tight spell)
Netherlands Innings: 176/7 (20.0 overs)
India Bowling: Shivam Dube 2/35; Varun Chakaravarthy (key spell)
Fall of Wickets: Both teams lost wickets at key phases — India’s came late (protecting the platform), Netherlands’ came at the critical juncture in overs 14–17.
Head-to-Head: India 2 wins, Netherlands 0 wins (100% win rate for India in head-to-head).
Conclusion
This was a Shivam Dube match. Not because he was the only one who contributed, but because his 66 off 31 balls is the single fact that best explains India’s total, and his 2/35 is one of the facts that best explains why Netherlands never truly threatened it. India won by 17 runs — a convincing margin dressed in a slightly flattering number. The turning points were the death overs in India’s innings and the fingerspin stranglehold in the middle of the chase. Netherlands showed they can compete. India showed they can dismantle a good chase with one batting performance. That is the India national cricket team vs Netherlands national cricket team match scorecard, explained fully.